Variance vs Standard Deviation: A Worked Example Guide
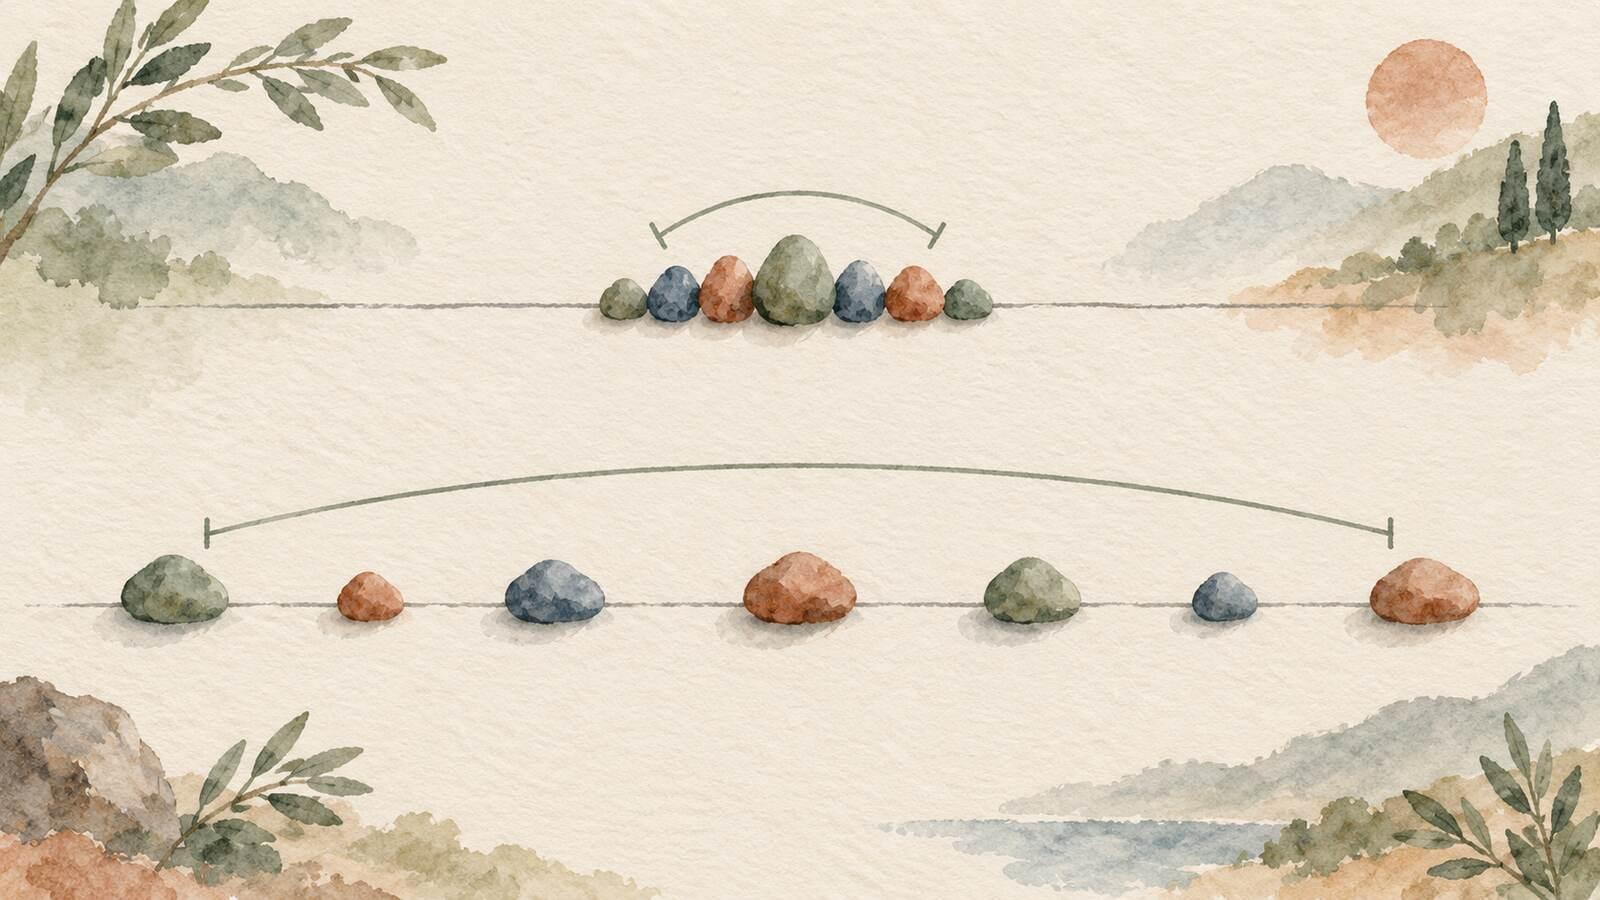
Two groups finish a puzzle in an average of four minutes. In the first group, everyone finishes in four minutes. In the second, half finish in two minutes and half in six. The means match, but the second group's times are spread out. Variance and standard deviation put a number on that difference.
They measure the same underlying feature, spread around the mean, but report it on different scales. Variance uses squared units. Standard deviation takes its square root and returns to the original units. If the data are minutes, the variance is in square minutes and the standard deviation is in minutes. The calculation also changes depending on whether your data cover an entire population or only a sample.
This guide works through one data set from start to finish. If you need the broader picture of means, medians, and distributions first, read our introduction to statistics.
Begin with deviations from the mean
Suppose eight puzzle attempts took these numbers of minutes:
Their total is minutes, so the mean is minutes. The next step is to subtract five from each time. The deviations are:
Negative means faster than the mean; positive means slower. These deviations add to zero, as deviations from an arithmetic mean always do. Simply averaging them would therefore report zero spread even for a data set with very different values. That is not useful. Squaring each deviation makes it nonnegative and gives larger departures more influence, as NIST's measures of scale reference explains.
Here are the eight squared deviations:
| Time, minutes | Deviation from 5, minutes | Squared deviation, minutes² |
|---|---|---|
| 2 | -3 | 9 |
| 4 | -1 | 1 |
| 4 | -1 | 1 |
| 4 | -1 | 1 |
| 5 | 0 | 0 |
| 5 | 0 | 0 |
| 7 | 2 | 4 |
| 9 | 4 | 16 |
The final column totals square minutes. That sum is the engine of both statistics. Nothing about the observed times changes from here. The denominator depends on what those eight times represent.
If these are the whole population
Imagine the eight attempts are every attempt in the small competition you care about. You are describing that complete group, not estimating a larger unseen group. Divide the squared-deviation sum by the number of values, :
That is the population variance. Its symbol is . Then take the square root:
That is the population standard deviation. The square root does not undo the calculation and produce the average absolute distance. It reverses the units and the scale after the deviations have already been squared and combined. The OpenStax section on spread gives the same population symbols and denominator.
What does two minutes mean here? It is a measure of the times' spread around the five-minute mean, expressed in minutes. It does not say every result lies within two minutes of five: this very list includes two and nine. It also does not imply that a particular fraction must fall inside that band. Such percentage rules require assumptions about the distribution, not merely a computed standard deviation.
If these are a sample
Now imagine those same eight times are selected from a much larger collection of attempts, and you want to estimate how variable that larger population is. The observed mean of five is itself computed from the sample. The usual sample variance uses in the denominator:
The sample standard deviation is:
The result is a little larger than the population calculation because the same sum, , is divided by seven instead of eight. This is not a choice between a generous and a strict formula. It answers two different questions: describe all eight values as the complete group, or use eight observed values to estimate the spread of a larger group. OpenStax's data science text sets out both formulas and the unit difference.
Why seven? The sample mean is fitted to these same observations, which tends to make their deviations look smaller than deviations from the unknown population mean. Using corrects that downward tendency for variance under the usual sampling setup. A useful mnemonic is that after fixing the sample mean, seven deviations can vary freely; the eighth must make their total zero. The deeper statistical reason concerns how the sample variance behaves across repeated samples. For this article, the practical rule is enough: establish whether you have a population or a sample before dividing.
Which number should you report?
Use variance when a calculation calls for squared spread or when you are doing further statistical work with a formula defined in terms of variance. Use standard deviation when you want a reader to compare spread with the original measurements. "A standard deviation of about 2.14 minutes" is immediately comparable with a five-minute mean; "a variance of about 4.57 square minutes" is mathematically exact but harder to picture.
Always attach the convention. "SD = 2" and "SD = 2.14" both come from the same eight times; without a population or sample label, a reader cannot tell why they differ. If your calculator offers and , those are not interchangeable buttons. Choose for the complete population description and for a sample calculation.
The unit matters too. If values are in centimeters, variance uses and standard deviation uses centimeters. If the values are unitless scores, both results are unitless. Calling both numbers "points" or both "square points" hides what the square root did.
Why not just use the range?
The range of our times is minutes. That tells you the distance between the extremes and nothing about the six values between them. Change a middle value while keeping two and nine fixed, and the range stays seven even though the overall pattern changes. Variance and standard deviation use every observation, so those middle changes affect the result.
That strength creates a limitation: squaring gives distant values considerable influence. In the worked data, the nine-minute attempt alone contributes of the square-minute total. This is a feature when a large departure matters, but it also means you should look at the data before interpreting a single spread number. NIST notes the stronger effect of large deviations in its comparison of spread measures. A standard deviation is not a substitute for noticing an unusual value or an asymmetric distribution.
For intuition, compare two four-value sets that both have mean four: and . The first has zero squared deviations and zero standard deviation. In the second, every value lies two units from four, so each squared deviation is four. Treating each set as a full population, its variance is four and its standard deviation is two. The common mean alone missed the entire distinction.
Common calculation mistakes
Dividing before deciding what the data represent. Write "population" or "sample" above the calculation. For a population use ; for a sample variance used to estimate a population, use . Mixing the two is the most common reason two correct-looking answers differ.
Forgetting the square root. The sum divided by the denominator is variance. The standard deviation is the square root of that number. Report both if the exercise asks for both.
Dropping the units. The squared-deviation sum and variance have squared units; the standard deviation has original units. This is a fast way to check your own work.
Calling it the average absolute difference. That is another measure, mean absolute deviation. Standard deviation squares first, then averages according to the population or sample convention, then takes a square root. Those operations generally give a different value.
Rounding every row. Keep exact squared deviations and the exact fraction as long as possible. For this data, gives a more accurate sample SD than taking the square root of a rounded variance.
Practice it without copying the table
Try and treat the four values as the complete population. The mean is . The deviations are , so the squared-deviation sum is . Population variance is square units, and population standard deviation is units. If instead these four values form a sample, divide by three: sample variance and sample SD .
Change just the last value from five to nine. Before calculating, predict whether the spread will rise. It will, but do the arithmetic again: the mean has also changed, so you cannot update only one row of the old deviation table. This is good practice for seeing why the mean and the spread must be calculated together.
Math Zen's statistics practice is useful after you can complete one table by hand. Use it to practice identifying the mean, choosing the right denominator, and checking whether your answer's units make sense. If the sample/population distinction still feels abstract, our probability guide explains why a sample is used to reason about a wider set of outcomes.
Frequently asked questions
Is variance always bigger than standard deviation?
No. They have different units, so a direct bigger-or-smaller comparison is usually meaningless. Numerically, if a variance is below one in some chosen unit, its square root is larger than the variance; if it is above one, its square root is smaller. Changing units can change that numerical comparison without changing the data.
Can standard deviation be negative?
No. Squared deviations are nonnegative, their sum is nonnegative, and the square root used for standard deviation is nonnegative. It is zero only when all observed values are equal.
When do I use n minus 1?
Use for the usual sample variance and sample standard deviation when the sample mean is calculated from those data. Use when the data are the entire population you intend to describe. Check the exercise wording before touching the calculator.
What is the simplest way to remember the distinction?
Variance is spread measured through squared deviations. Standard deviation is the square root of that variance, back in the data's original units. The example above moves from squared minutes in total, to square minutes of population variance, to minutes of population standard deviation.
Common Questions
- What is the difference between variance and standard deviation?
- Variance is the mean squared deviation from the mean for a population, or the sum of squared deviations divided by n minus 1 for a sample. Standard deviation is the square root of the corresponding variance, so it uses the data's original units.
- Why does sample variance divide by n minus 1?
- The sample mean is estimated from the same data. Dividing the squared-deviation sum by n minus 1 corrects the usual downward bias when using that sample to estimate population variance. For a complete population, divide by N.
- Is standard deviation the average distance from the mean?
- No. It comes from squaring deviations, averaging with the appropriate denominator, and taking a square root. Mean absolute deviation averages absolute distances instead. Both measure spread, but they are different numbers.